CubingTime Charts: Enhance Your Cubing Experience with Additional Graphs
CubingTime Charts is a free Chrome add-on developed by nchikovany1. This add-on complements the speedcubing timer on cubingtime.com by providing two types of graphs.
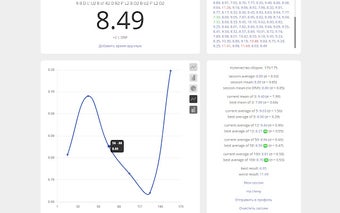
The first graph is a linear chart that displays the average time for specific intervals of solves. This allows users to track their progress over time and identify any areas for improvement. Whether you're a beginner or an advanced speedcuber, this graph can provide valuable insights into your solving performance.
The second graph is a bar chart that shows the distribution of solves within different time intervals. These intervals are intelligently selected to ensure optimal visualization of solve data. By hovering over each bar, users can see the percentage of solves falling within that interval, giving them a clear understanding of their solve distribution.
With CubingTime Charts, speedcubers can now analyze their solving data in a more comprehensive and visually appealing way. This add-on is a valuable tool for anyone looking to improve their speedcubing skills.